
Sequence of Primatives
This assignment was a primative exploration into visualising statistics through basic programming. Exploring various methods of interpretation and communication through a limited colour pallet.
I chose to focus on UNSDG 15: Life on land. Protecting, caring for and restoring our ecosystems is a key sustainable development goal.
Human population growth has lead to an increase in land occupation and use. This increase in human land use has in turn, led to an increase in habitat fragmentation.

Habitat Fragmentation is a critical issue we are facing both worldwide and in New Zealand. It comes as a result of many factors, most prevalent of which are the clearing of land for agriculture, and Urban Development. Habitat fragmentation occurs when the reduction in habitat area breaks habitats into separate, smaller isolated patches that function less effectively then larger ecosystems. Species richness is directly linked to habitat area. Smaller habitat areas lead to fewer species, and this decrease in biodiversity can be detrimental to our ecosystems.
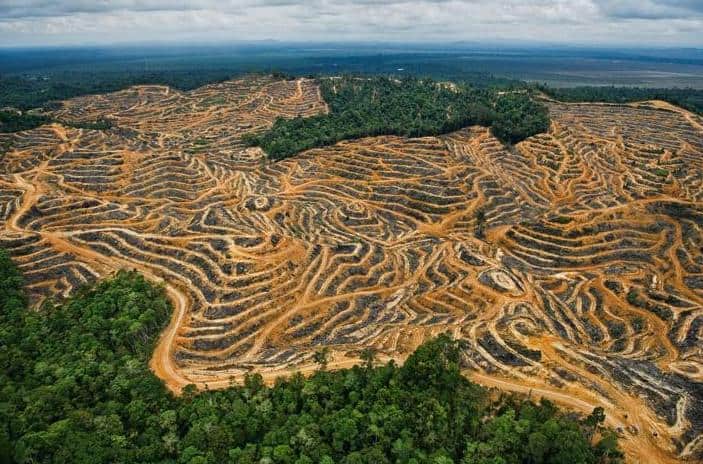
63% of New Zealands once richly diverse land area has been converted for human occupation and use.
This statistic is particularly interesting to me when considering the implications on habitat loss and fragmentation that has occurred as a result; and the projected further increase in human land use.
Authenticity
When considering the authenticity of this data, it is relevant to note that the New Zealand Biodiversity Strategy it was published in was conducted in February of 2000. This makes the statistic over 20 years old. However, I believe that when considering the larger timeline of New Zealand’s land use history, this is not a significant drawback. I was unable to find a newer statistic, which is potentially due to a lack of data altogether. The report is cited in the Department of Conservations global assets database, indicating that it is reliable; however, potentially inaccurate due to the somewhat outdated nature of the data.
Purpose
To illustrate the expansion of human land use in an abstract way. To inform in a way that shows the enormity of our impact on the natural environment and highlight the dangers of habitat fragmentation as a result of human land use expansion if we do not protects biodiversity hotspots.
Iterations
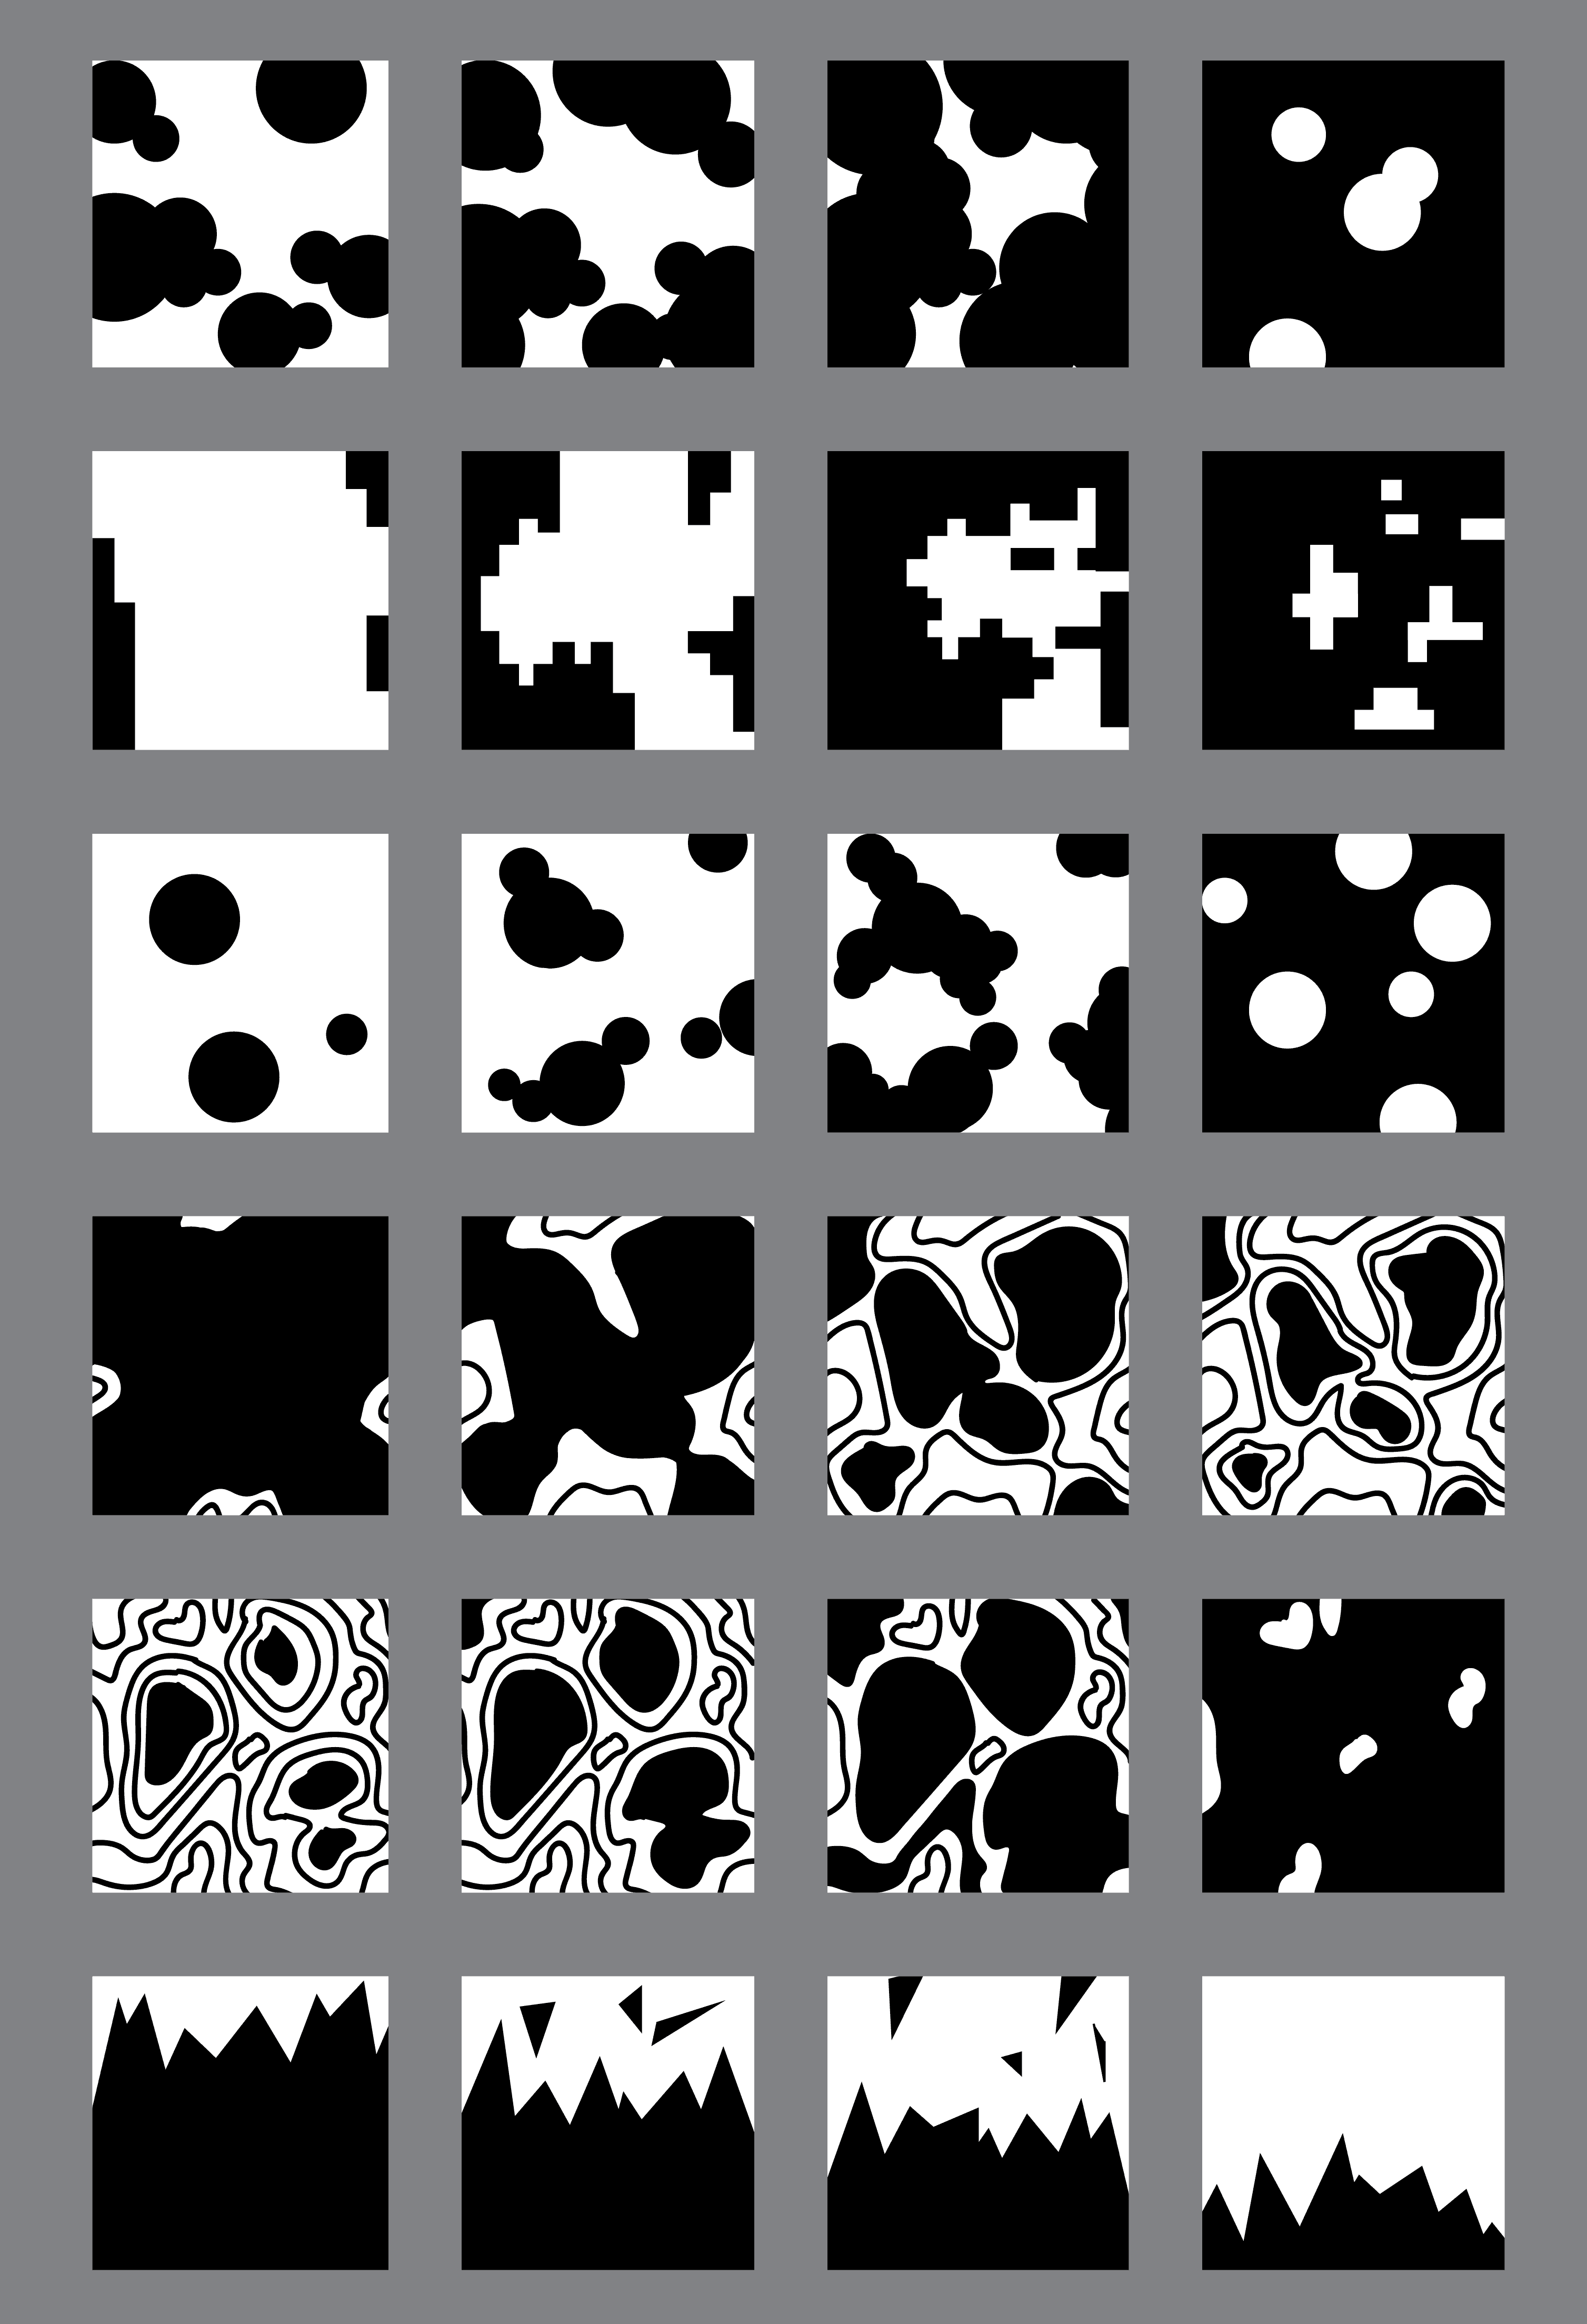
Through iterative sketching I came up with 6 story board concepts. I asked my peers for their advice on which one best communicates my narrative.
I asked my peers which of the 6 ideations they thought were the best for conveying my statistic about human land use. They put stars next to their top ideas, which helped me to select one to continue forward with.
Experimenting with Processing
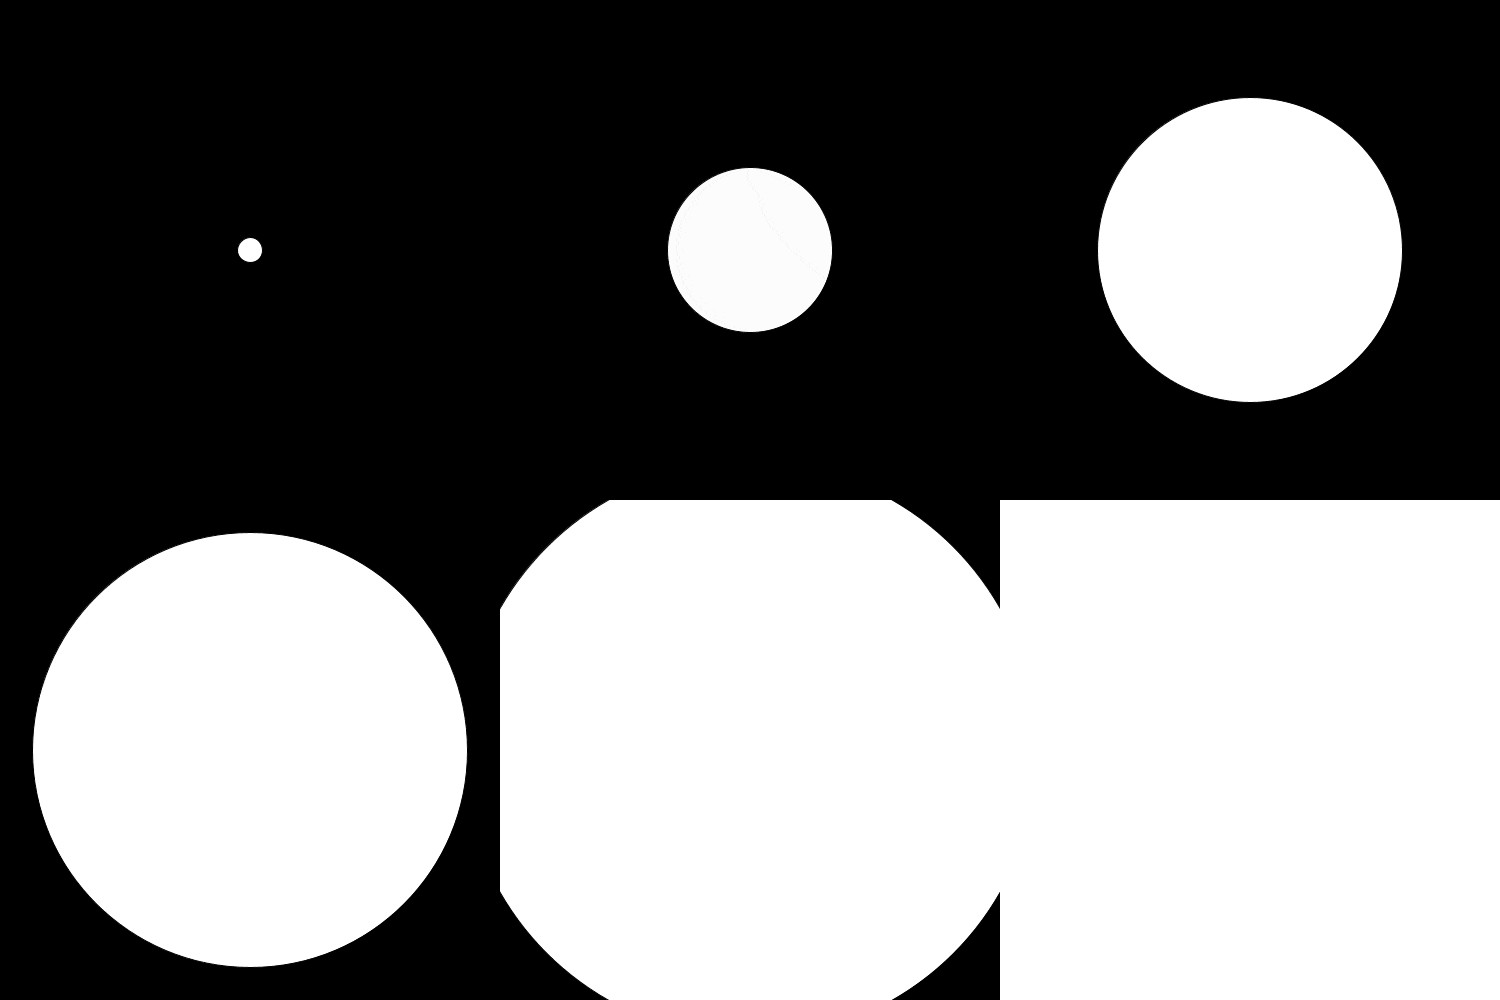
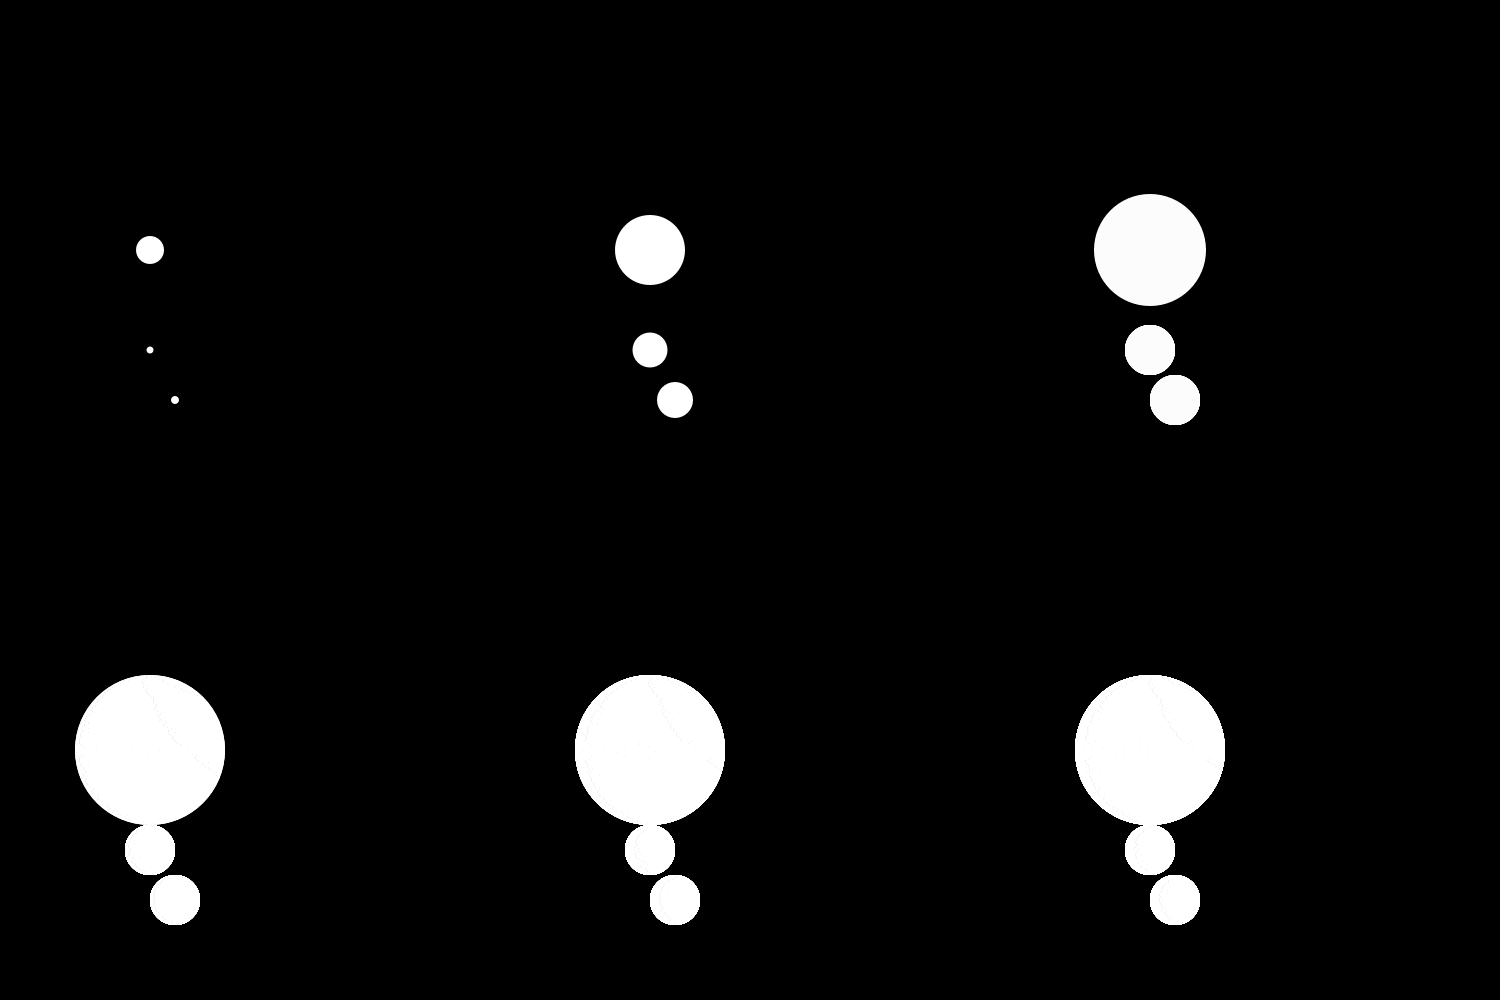
I started exploring the idea of making the circles that represent the growing human occupation of land expansion.
Peer Feedback
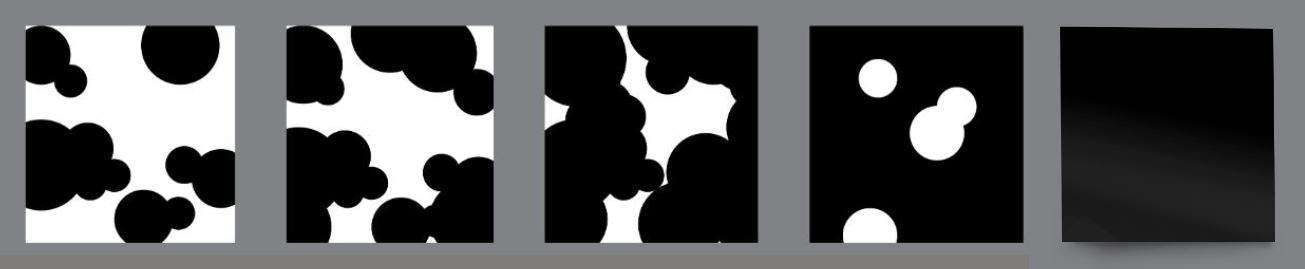
I asked my peers in class about alterations I should make to my animation, and one point that was raised that the white dots (which represent the area of NZ not being used by humans) were inaccurate to the statistic. I solved this by adding more so that the black area takes up closer to 63% of the space, as my statistic shows.
Code Efficiency
I received help in figuring out a more efficient way of implementing expanding circles using arrays so that they appear one after another, rather than all at once as I had previously.
Desired Effect
I decided to end the animation after the frame turns black, rather than starting again in an inverse colour to form a seamless loop. I decided not to repeat it because I felt that it was not conveying the correct message. A seamless loop where the white dots reappear would convey a sense that it is being resolved, whereas it is still an issue, so I feel that the sense of finality and importance that ending on the black screen brings conveys a more powerful message and call to action

Exporting Frames
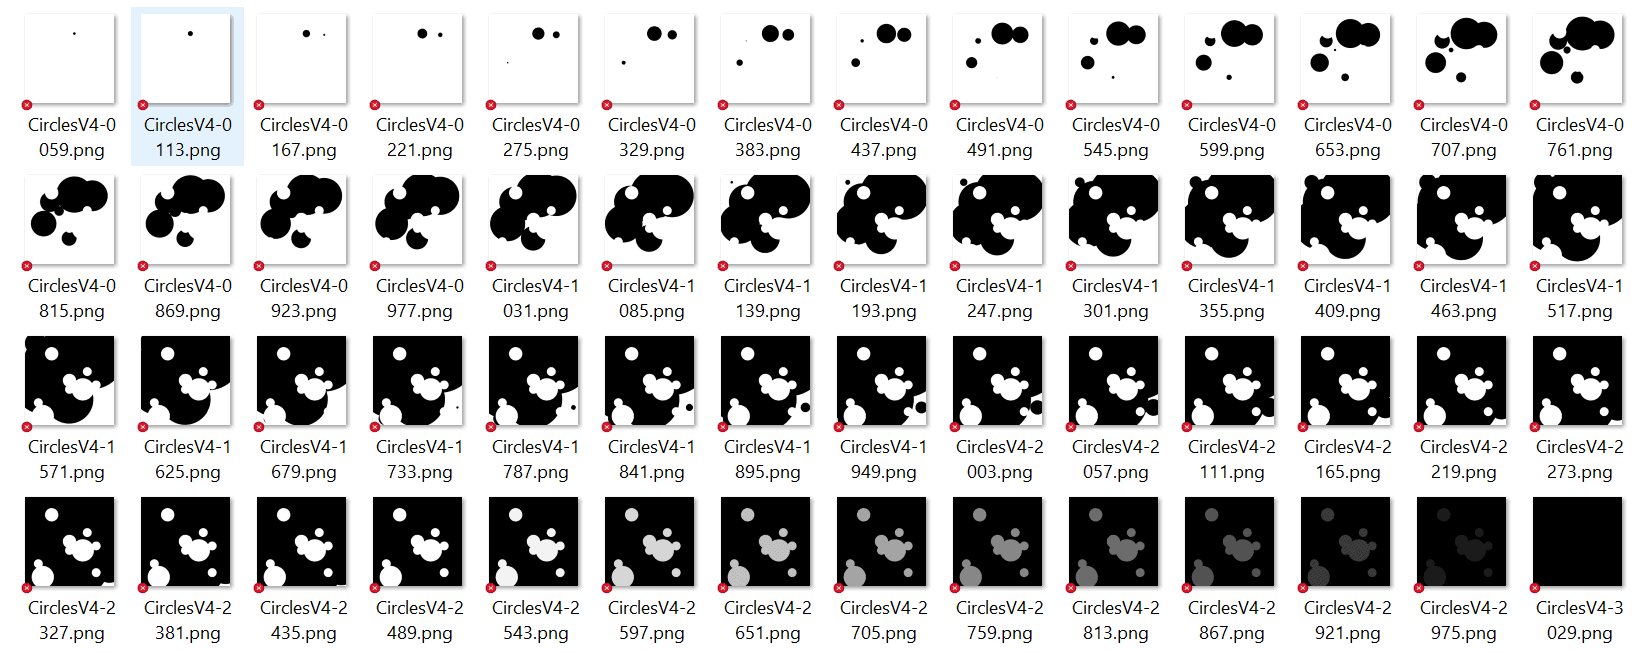
When I came to exporting my frames, I found that the animation ran significantly slower, regardless of the frame count I specified. This issue led to a gif that was also very slow. To solve this, I ran my gif through a gif speed changing software.
Polishing my code
I added a fade to black function, where after all of the black dots have appeared and expanded to cover 63% of the screen, the white dots start fading away, signifying the risks that habitat loss poses to ecosystems.
Final Output + Artist Statement of Intent
This abstract graphic animation intends to help the public visualise the statistic “63% of New Zealands once richly diverse land area has been converted for human occupation and use.“
Increasing human land use is an issue when it leads to habitat fragmentation. Areas where New Zealand’s native flora and fauna once flourished are infringed upon, shrunk and cleared out. Biodiversity is a crucial factor in an ecosystem’s strength; the less biodiversity, the weaker the ecosystem will be. When large habitats get fragmented due to human intervention, it decreases the biodiversity, and they no longer function as effectively.

With rapid urbanisation, rising agriculture sectors, and population growth, expansion of human land use is expected; however, with my visualisation of this statistic, I hope to draw attention to the importance of protecting habitats and creating areas within urban environments that are rich in biodiversity.
sequenceOfPrimatives.pde
int count = 100;
int wait = 0;
int[] posX;
int[] posY;
int[] size;
int tracker;
int fade = 255;

void setup() {
    size(1000, 1000);
    background(255);
    frameRate(500);

    posX = new int[1];
    posY = new int[1];
    size = new int[1];

    posX[0] = int(random(width));
    posY[0] = int(random(height));
    size[0] = 0;
}

void draw() {
    addCircle();

    fill(0);
    for (int i =0; i<posX.length; i++) {
        circle(posX[i], posY[i], size[i]);
    }

    for (int i =0; i < size.length; i++) {
        size[i]++;
    }

    wait++;

    fill(255);
    noStroke();
    circle(500,500,150);
    circle(650,600,250);
    circle(700,400,100);
    circle(300,200,150);
    circle(200,900,250);
    circle(150,750,100);
    circle(800,850,100);
    circle(500,600,100);
    circle(800,550,100);

    if (tracker>20){
        background(0);
        fill(fade, fade, fade);
        noStroke();
        circle(500,500,150);
        circle(650,600,250);
        circle(700,400,100);
        circle(300,200,150);
        circle(200,900,250);
        circle(150,750,100);
        circle(800,850,100);
        circle(500,600,100);
        circle(800,550,100);
        fade = fade - 1;
    }
}
void addCircle() {
    if (wait == 60) {
        //append array
        posX = append(posX, int(random(width)));
        posY = append(posY, int(random(height)));
        size = append(size, 0);
        tracker = tracker + 1;
        wait = 0;
    }
}